|
|
||
|---|---|---|
| .github/workflows | ||
| api | ||
| cmd | ||
| config | ||
| docs | ||
| helpertest | ||
| lists | ||
| metrics | ||
| resolver | ||
| server | ||
| stats | ||
| testdata | ||
| util | ||
| web | ||
| .dockerignore | ||
| .gitignore | ||
| .golangci.yml | ||
| Dockerfile | ||
| LICENSE | ||
| Makefile | ||
| codecov.yml | ||
| go.mod | ||
| go.sum | ||
| main.go | ||
docs/README.md


Blocky
Blocky is a DNS proxy for local network written in Go with following features:
- Blocking of DNS queries with external lists (Ad-block) with whitelisting
- Definition of black and white lists per client group (Kids, Smart home devices etc) -> for example: you can block some domains for you Kids and allow your network camera only domains from a whitelist
- periodical reload of external black and white lists
- blocking of request domain, response CNAME (deep CNAME inspection) and response IP addresses (against IP lists)
- Caching of DNS answers for queries -> improves DNS resolution speed and reduces amount of external DNS queries
- Custom DNS resolution for certain domain names
- Supports UDP, TCP and TCP over TLS DNS resolvers with DNSSEC support
- Supports DNS over HTTPS (DoH) resolvers
- Delegates DNS query to 2 external resolver from a list of configured resolvers, uses the answer from the fastest one -> improves you privacy and resolution time
- Logging of all DNS queries per day / per client in a text file
- Simple configuration in a single file
- Prometheus metrics
- Only one binary in docker container, low memory footprint
- Runs fine on raspberry pi
Installation and configuration
Create config.yml file with your configuration:
upstream:
    # these external DNS resolvers will be used. Blocky picks 2 random resolvers from the list for each query
    # format for resolver: net:host:[port][/path]. net could be tcp, udp, tcp-tls or https (DoH). If port is empty, default port will be used (53 for udp and tcp, 853 for tcp-tls, 443 for https (Doh))
    externalResolvers:
      - udp:8.8.8.8
      - udp:8.8.4.4
      - udp:1.1.1.1
      - tcp-tls:1.0.0.1:853
      - https://cloudflare-dns.com/dns-query

# optional: custom IP address for domain name (with all sub-domains)
# example: query "printer.lan" or "my.printer.lan" will return 192.168.178.3
customDNS:
    mapping:
      printer.lan: 192.168.178.3

# optional: definition, which DNS resolver should be used for queries to the domain (with all sub-domains).
# Example: Query client.fritz.box will ask DNS server 192.168.178.1. This is necessary for local network, to resolve clients by host name
conditional:
    mapping:
      fritz.box: udp:192.168.178.1

# optional: use black and white lists to block queries (for example ads, trackers, adult pages etc.)
blocking:
    # definition of blacklist groups. Can be external link (http/https) or local file
    blackLists:
      ads:
        - https://s3.amazonaws.com/lists.disconnect.me/simple_ad.txt
        - https://raw.githubusercontent.com/StevenBlack/hosts/master/hosts
        - https://mirror1.malwaredomains.com/files/justdomains
        - http://sysctl.org/cameleon/hosts
        - https://zeustracker.abuse.ch/blocklist.php?download=domainblocklist
        - https://s3.amazonaws.com/lists.disconnect.me/simple_tracking.txt
      special:
        - https://hosts-file.net/ad_servers.txt
    # definition of whitelist groups. Attention: if the same group has black and whitelists, whitelists will be used to disable particular blacklist entries. If a group has only whitelist entries -> this means only domains from this list are allowed, all other domains will be blocked
    whiteLists:
      ads:
        - whitelist.txt
    # definition: which groups should be applied for which client
    clientGroupsBlock:
      # default will be used, if no special definition for a client name exists
      default:
        - ads
        - special
      # use client name or ip address
      laptop.fritz.box:
        - ads
    # which response will be sent, if query is blocked:
    # zeroIp: 0.0.0.0 will be returned (default)
    # nxDomain: return NXDOMAIN as return code
    blockType: zeroIp
    # optional: automatically list refresh period in minutes. Default: 4h.
    # Negative value -> deactivate automatically refresh.
    # 0 value -> use default
    refreshPeriod: 1

# optional: configuration for caching of DNS responses
caching:
  # amount in minutes, how long a response must be cached (min value).
  # If <=0, use response's TTL, if >0 use this value, if TTL is smaller
  # Default: 0
  minTime: 40
  # amount in minutes, how long a response must be cached (max value).
  # If <0, do not cache responses
  # If 0, use TTL
  # If > 0, use this value, if TTL is greater
   # Default: 0
  maxTime: -1

# optional: configuration of client name resolution
clientLookup:
    # this DNS resolver will be used to perform reverse DNS lookup (typically local router)
    upstream: udp:192.168.178.1
    # optional: some routers return multiple names for client (host name and user defined name). Define which single name should be used.
    # Example: take second name if present, if not take first name
    singleNameOrder:
      - 2
      - 1
# optional: configuration for prometheus metrics endpoint
prometheus:
  # enabled if true
  enable: true
  # url path, optional (default '/metrics')
  path: /metrics

# optional: write query information (question, answer, client, duration etc) to daily csv file
queryLog:
    # directory (should be mounted as volume in docker)
    dir: /logs
    # if true, write one file per client. Writes all queries to single file otherwise
    perClient: true
    # if > 0, deletes log files which are older than ... days
    logRetentionDays: 7

# optional: DNS listener port, default 53 (UDP and TCP)
port: 53
# optional: HTTP listener port, default 0 = no http listener. If > 0, will be used for prometheus metrics, pprof, REST API, ...
httpPort: 4000
# optional: use this DNS server to resolve blacklist urls and upstream DNS servers (DOH). Useful if no DNS resolver is configured and blocky needs to resolve a host name. Format net:IP:port, net must be udp or tcp
bootstrapDns: tcp:1.1.1.1
# optional: Log level (one from debug, info, warn, error). Default: info
logLevel: info
Run with docker
Start docker container with following docker-compose.yml file:
version: "2.1"
services:
  blocky:
    image: spx01/blocky
    container_name: blocky
    restart: unless-stopped
    ports:
      - "53:53/tcp"
      - "53:53/udp"
    environment:
      - TZ=Europe/Berlin
    volumes:
      # config file
      - ./config.yml:/app/config.yml
      # write query logs in this directory. You can also use a volume
      - ./logs:/logs
Run standalone
Download binary file for your architecture and run ./blocky --config config.yml. Please be aware, you must run the binary with root privileges if you want to use port 53 or 953.
Run with kubernetes (helm)
See this repo or the helm hub site for details about running blocky via helm in kubernetes.
CLI / REST API
If http listener is enabled, blocky provides REST API to control blocking status. Swagger documentation under http://host:port/swagger
To run CLI, please ensure, that blocky DNS server is running, than execute blocky help for help or
./blocky blocking enableto enable blocking./blocky blocking disableto disable blocking./blocky blocking disable --duration [duration]to disable blocking for a certain amount of time (30s, 5m, 10m30s, ...)./blocky blocking statusto print current status of blocking
To run this inside docker run docker exec blocky ./blocky blocking status
Additional information
Prometheus
Blocky can export metrics for prometheus. Example grafana dashboard definition as JSON
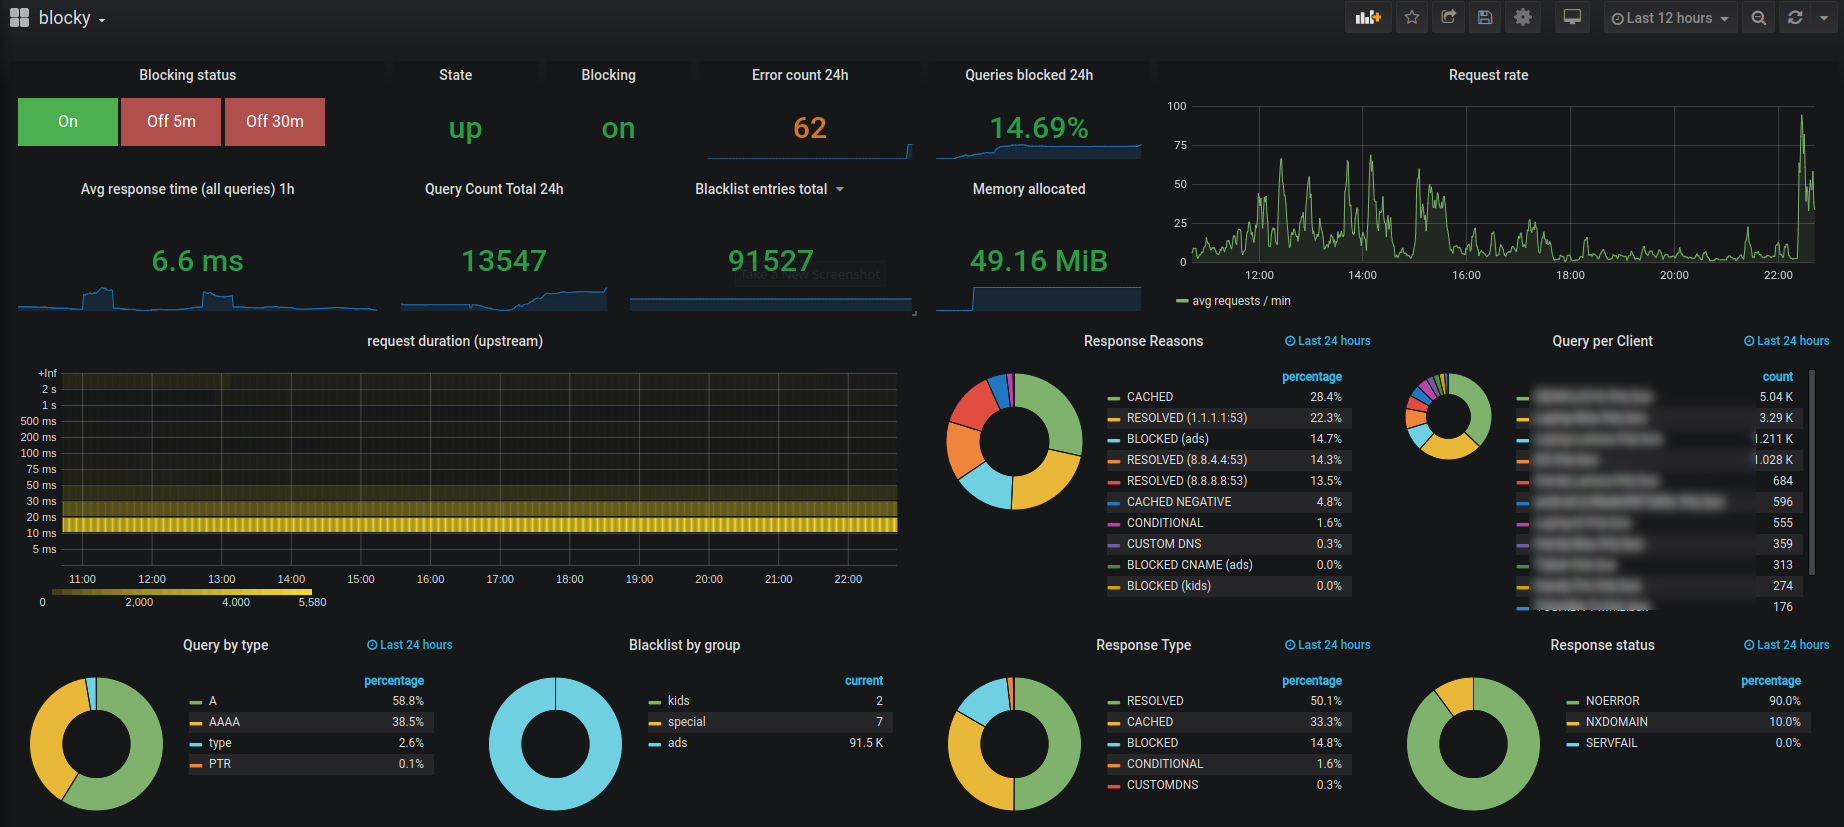 . Please install
 grafana-piechart-panel and set disable-sanitize-html in config or as env to use control buttons to enable/disable the blocking status.
Following metrics are being exported:
| name | Description |
|---|---|
| blocky_blacklist_cache / blocky_whitelist_cache | Number of entries in blacklist/whitelist cache, partitioned by group |
| blocky_error_total | Counter for internal errors |
| blocky_query_total | Number of total queries, partitioned by client and DNS request type (A, AAAA, PTR, etc) |
| blocky_request_duration_ms_bucket | Request duration histogram, partitioned by response type (Blocked, cached, etc) |
| blocky_response_total | Number of responses, partitioned by response type (Blocked, cached, etc), DNS response code, and reason |
Print current configuration
To print runtime configuration / statistics, you can send SIGUSR1 signal to running process
Statistics
blocky collects statistics and aggregates them hourly. If signal SIGUSR2 is received, this will print statistics for last 24 hours:
- Top 20 queried domains
- Top 20 blocked domains
- Query count per client ...
Hint: To send a signal to a process you can use kill -s USR1 <PID> or docker kill -s SIGUSR1 blocky for docker setup
Debug / Profiling
If http listener is enabled, pprof endpoint (/debug/pprof) is enabled automatically.