13 KiB
Gantt diagrams
A Gantt chart is a type of bar chart, first developed by Karol Adamiecki in 1896, and independently by Henry Gantt in the 1910s, that illustrates a project schedule and the amount of time it would take for any one project to finish. Gantt charts illustrate number of days between the start and finish dates of the terminal elements and summary elements of a project.
A note to users
Gantt Charts will record each scheduled task as one continuous bar that extends from the left to the right. The x axis represents time and the y records the different tasks and the order in which they are to be completed.
It is important to remember that when a date, day, or collection of dates specific to a task are "excluded", the Gantt Chart will accomodate those changes by extending an equal number of day, towards the right, not by creating a gap inside the task.
As shown here 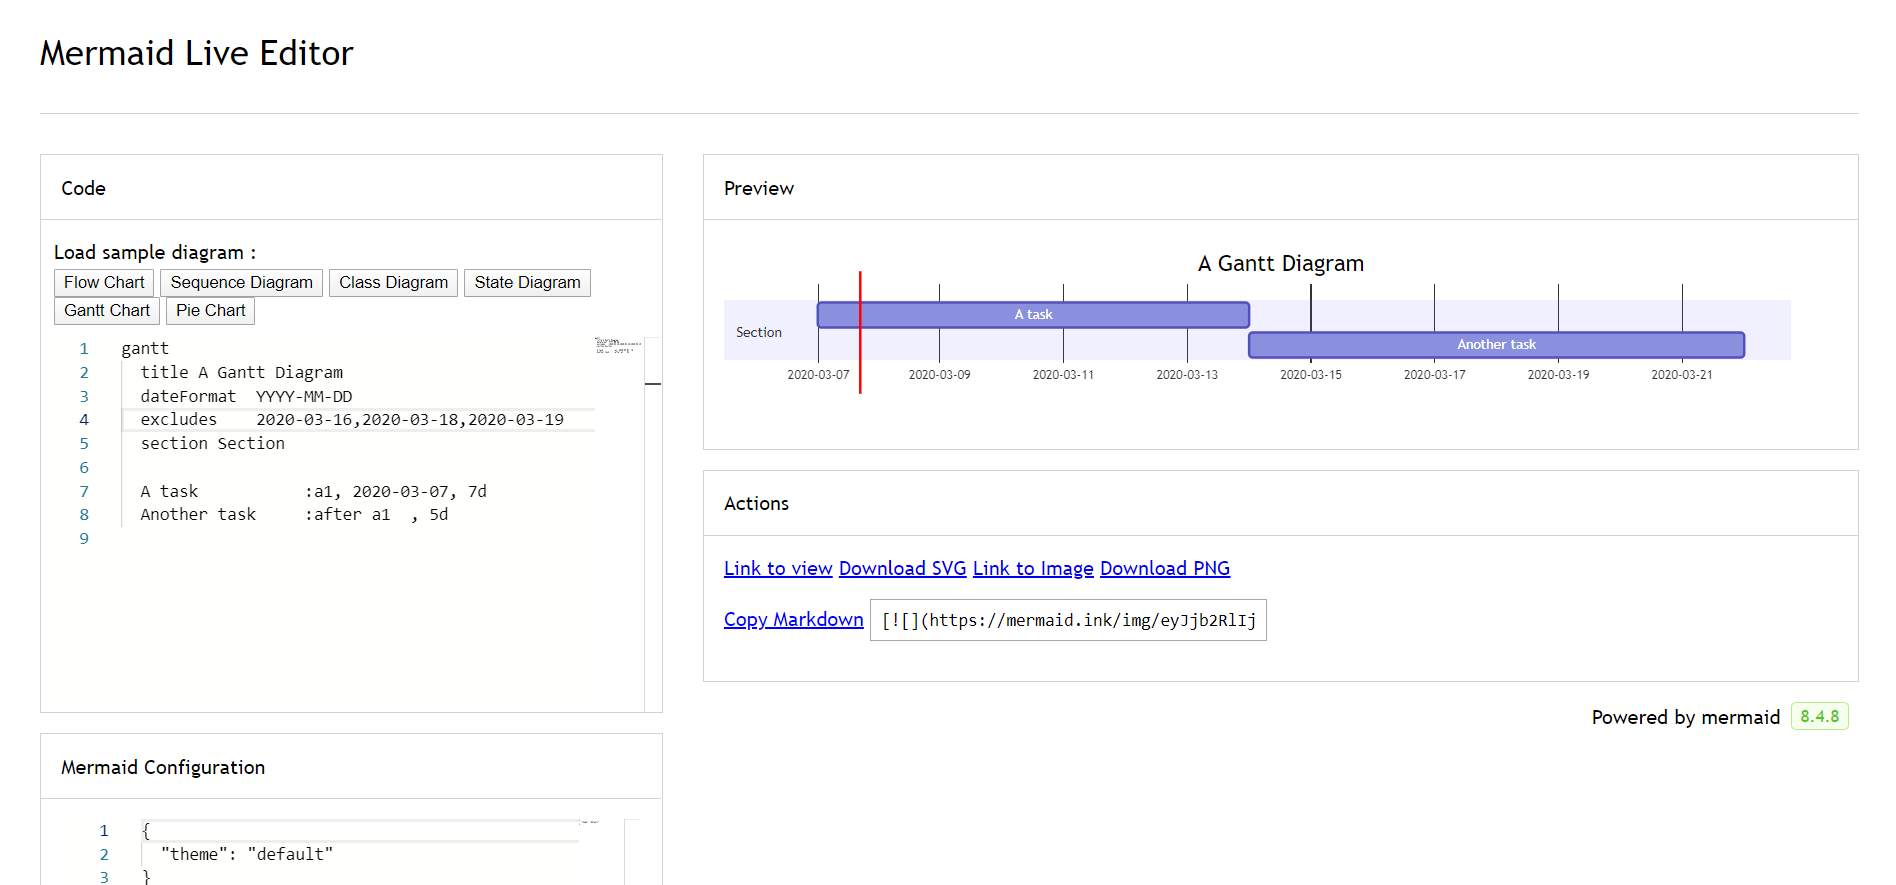
However, if the excluded dates are between two tasks that are set to start consecutively, the excluded dates will be skipped graphically and left blank, and the following task will begin after the end of the excluded dates.
As shown here 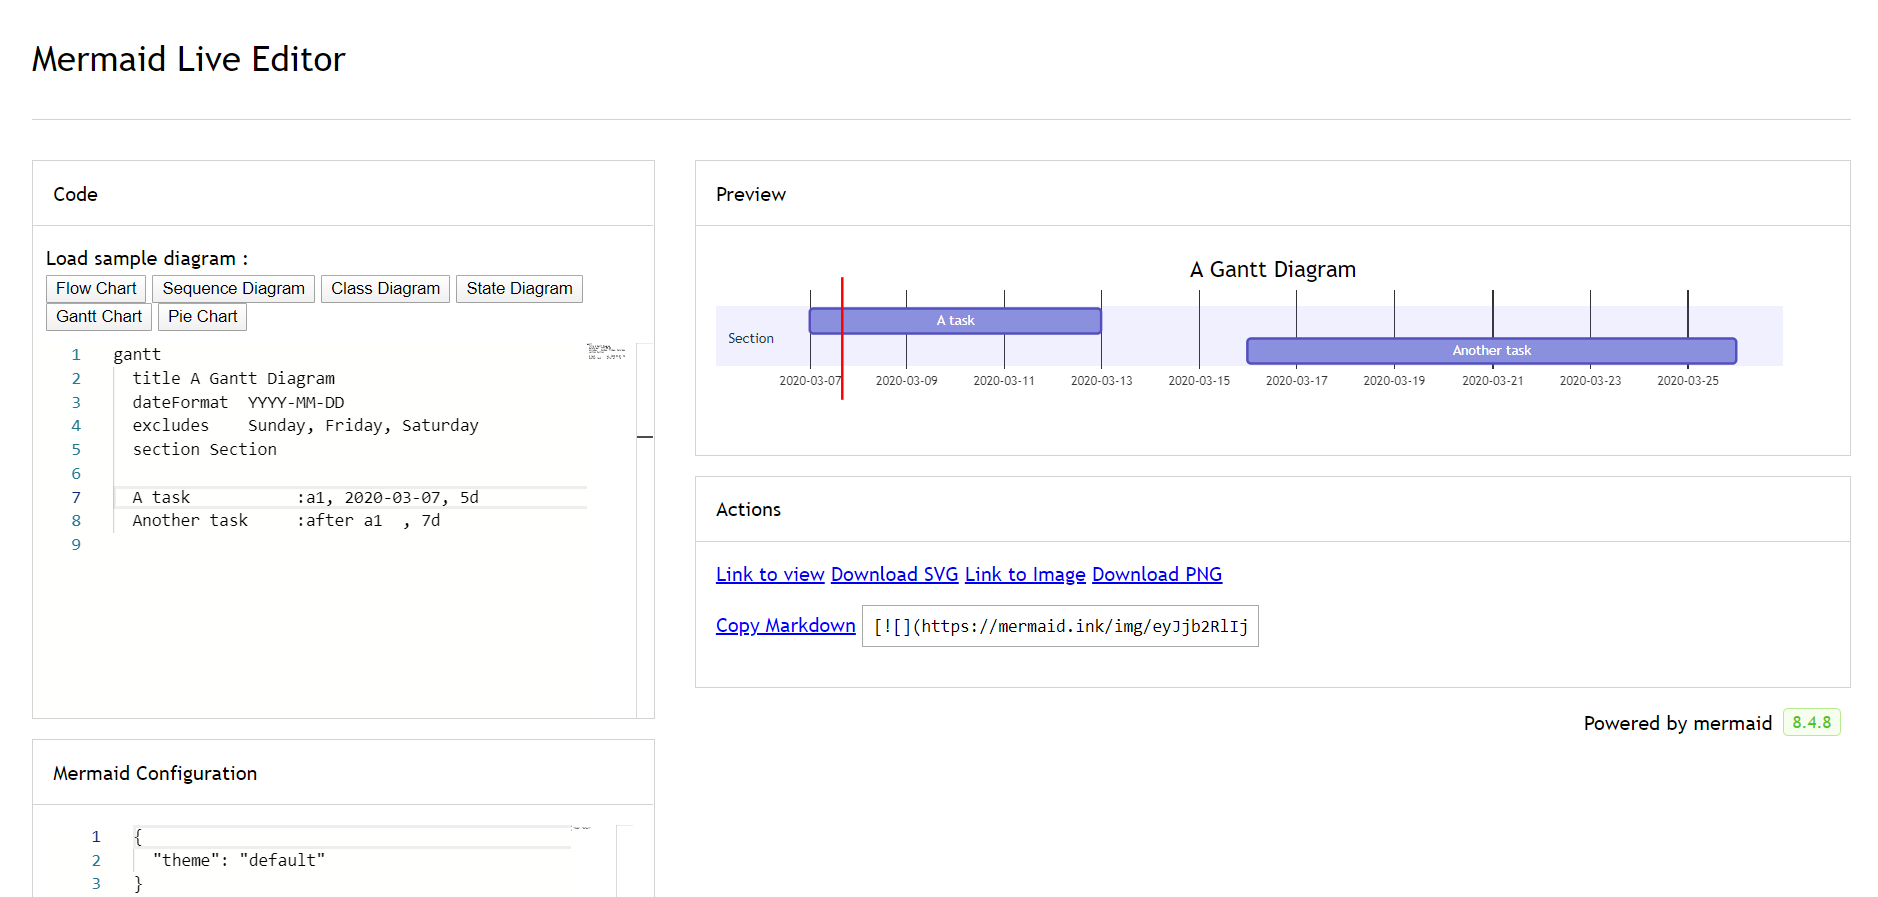
A Gantt chart is useful for tracking the amount of time it would take before a project is finished, but it can also be used to graphically represent "non-working days", with a few tweaks.
Mermaid can render Gantt diagrams as SVG, PNG or a MarkDown link that can be pasted into docs.
gantt
    title A Gantt Diagram
    dateFormat  YYYY-MM-DD
    section Section
    A task           :a1, 2014-01-01, 30d
    Another task     :after a1  , 20d
    section Another
    Task in sec      :2014-01-12  , 12d
    another task      : 24d
gantt
    title A Gantt Diagram
    dateFormat  YYYY-MM-DD
    section Section
    A task           :a1, 2014-01-01, 30d
    Another task     :after a1  , 20d
    section Another
    Task in sec      :2014-01-12  , 12d
    another task      : 24d
Syntax
gantt
    dateFormat  YYYY-MM-DD
    title       Adding GANTT diagram functionality to mermaid
    excludes    weekends
    %% (`excludes` accepts specific dates in YYYY-MM-DD format, days of the week ("sunday") or "weekends", but not the word "weekdays".)

    section A section
    Completed task            :done,    des1, 2014-01-06,2014-01-08
    Active task               :active,  des2, 2014-01-09, 3d
    Future task               :         des3, after des2, 5d
    Future task2              :         des4, after des3, 5d

    section Critical tasks
    Completed task in the critical line :crit, done, 2014-01-06,24h
    Implement parser and jison          :crit, done, after des1, 2d
    Create tests for parser             :crit, active, 3d
    Future task in critical line        :crit, 5d
    Create tests for renderer           :2d
    Add to mermaid                      :1d

    section Documentation
    Describe gantt syntax               :active, a1, after des1, 3d
    Add gantt diagram to demo page      :after a1  , 20h
    Add another diagram to demo page    :doc1, after a1  , 48h

    section Last section
    Describe gantt syntax               :after doc1, 3d
    Add gantt diagram to demo page      :20h
    Add another diagram to demo page    :48h
It is possible to set multiple dependencies separated by space:
    gantt
        apple :a, 2017-07-20, 1w
        banana :crit, b, 2017-07-23, 1d
        cherry :active, c, after b a, 1d
    gantt
        apple :a, 2017-07-20, 1w
        banana :crit, b, 2017-07-23, 1d
        cherry :active, c, after b a, 1d
Title
The title is an optional string to be displayed at the top of the Gantt chart to describe the chart as a whole.
Section statements
You can divide the chart into various sections, for example to separate different parts of a project like development and documentation.
To do so, start a line with the section keyword and give it a name. (Note that unlike with the title for the entire chart, this name is required.
Setting dates
dateFormat defines the format of the date input of your gantt elements. How these dates are represented in the rendered chart output are defined by axisFormat.
Input date format
The default input date format is YYYY-MM-DD. You can define your custom dateFormat.
dateFormat YYYY-MM-DD
The following formating options are supported:
Input	Example	Description:
YYYY	2014	4 digit year
YY	14	2 digit year
Q	1..4	Quarter of year. Sets month to first month in quarter.
M MM	1..12	Month number
MMM MMMM	January..Dec	Month name in locale set by moment.locale()
D DD	1..31	Day of month
Do	1st..31st	Day of month with ordinal
DDD DDDD	1..365	Day of year
X	1410715640.579	Unix timestamp
x	1410715640579	Unix ms timestamp
H HH	0..23	24 hour time
h hh	1..12	12 hour time used with a A.
a A	am pm	Post or ante meridiem
m mm	0..59	Minutes
s ss	0..59	Seconds
S	0..9	Tenths of a second
SS	0..99	Hundreds of a second
SSS	0..999	Thousandths of a second
Z ZZ	+12:00	Offset from UTC as +-HH:mm, +-HHmm, or Z
More info in: http://momentjs.com/docs/#/parsing/string-format/
Output date format on the axis
The default output date format is YYYY-MM-DD. You can define your custom axisFormat, like 2020-Q1 for the first quarter of the year 2020.
axisFormat %Y-%m-%d
The following formating strings are supported:
%a - abbreviated weekday name.
%A - full weekday name.
%b - abbreviated month name.
%B - full month name.
%c - date and time, as "%a %b %e %H:%M:%S %Y".
%d - zero-padded day of the month as a decimal number [01,31].
%e - space-padded day of the month as a decimal number [ 1,31]; equivalent to %_d.
%H - hour (24-hour clock) as a decimal number [00,23].
%I - hour (12-hour clock) as a decimal number [01,12].
%j - day of the year as a decimal number [001,366].
%m - month as a decimal number [01,12].
%M - minute as a decimal number [00,59].
%L - milliseconds as a decimal number [000, 999].
%p - either AM or PM.
%S - second as a decimal number [00,61].
%U - week number of the year (Sunday as the first day of the week) as a decimal number [00,53].
%w - weekday as a decimal number [0(Sunday),6].
%W - week number of the year (Monday as the first day of the week) as a decimal number [00,53].
%x - date, as "%m/%d/%Y".
%X - time, as "%H:%M:%S".
%y - year without century as a decimal number [00,99].
%Y - year with century as a decimal number.
%Z - time zone offset, such as "-0700".
%% - a literal "%" character.
More info in: https://github.com/mbostock/d3/wiki/Time-Formatting
Comments
Comments can be entered within a gantt chart, which will be ignored by the parser. Comments need to be on their own line, and must be prefaced with %% (double percent signs). Any text after the start of the comment to the next newline will be treated as a comment, including any diagram syntax
gantt
    title A Gantt Diagram
    %% this is a comment
    dateFormat  YYYY-MM-DD
    section Section
    A task           :a1, 2014-01-01, 30d
    Another task     :after a1  , 20d
    section Another
    Task in sec      :2014-01-12  , 12d
    another task      : 24d
Styling
Styling of the a gantt diagram is done by defining a number of css classes. During rendering these classes are extracted from the
Classes used
| Class | Description |
|---|---|
| actor | Style for the actor box at the top of the diagram. |
| text.actor | Styles for text in the actor box at the top of the diagram. |
| actor-line | The vertical line for an actor. |
| messageLine0 | Styles for the solid message line. |
| messageLine1 | Styles for the dotted message line. |
| messageText | Defines styles for the text on the message arrows. |
| labelBox | Defines styles label to left in a loop. |
| labelText | Styles for the text in label for loops. |
| loopText | Styles for the text in the loop box. |
| loopLine | Defines styles for the lines in the loop box. |
| note | Styles for the note box. |
| noteText | Styles for the text on in the note boxes. |
Sample stylesheet
.grid .tick {
    stroke: lightgrey;
    opacity: 0.3;
    shape-rendering: crispEdges;
}
.grid path {
    stroke-width: 0;
}

#tag {
    color: white;
    background: #FA283D;
    width: 150px;
    position: absolute;
    display: none;
    padding:3px 6px;
    margin-left: -80px;
    font-size: 11px;
}

#tag:before {
    border: solid transparent;
    content: ' ';
    height: 0;
    left: 50%;
    margin-left: -5px;
    position: absolute;
    width: 0;
    border-width: 10px;
    border-bottom-color: #FA283D;
    top: -20px;
}
.taskText {
    fill:white;
    text-anchor:middle;
}
.taskTextOutsideRight {
    fill:black;
    text-anchor:start;
}
.taskTextOutsideLeft {
    fill:black;
    text-anchor:end;
}
Today marker
You can style or hide the marker for the current date. To style it, add a value for the todayMarker key.
todayMarker stroke-width:5px,stroke:#0f0,opacity:0.5
To hide the marker, set todayMarker to off.
todayMarker off
Configuration
Is it possible to adjust the margins for rendering the gantt diagram.
This is done by defining the ganttConfig part of the configuration object.
How to use the CLI is described in the mermaidCLI page.
mermaid.ganttConfig can be set to a JSON string with config parameters or the corresponding object.
mermaid.ganttConfig = {
    titleTopMargin:25,
    barHeight:20,
    barGap:4,
    topPadding:75,
    sidePadding:75
}
Possible configration params:
| Param | Descriotion | Default value |
|---|---|---|
| mirrorActor | Turns on/off the rendering of actors below the diagram as well as above it | false |
| bottomMarginAdj | Adjusts how far down the graph ended. Wide borders styles with css could generate unwanted clipping which is why this config param exists. | 1 |
Interaction
It is possible to bind a click event to a task, the click can lead to either a javascript callback or to a link which will be opened in the current browser tab. Note: This functionality is disabled when using securityLevel='strict' and enabled when using securityLevel='loose'.
click taskId call callback(arguments)
click taskId href URL
- taskId is the id of the task
- callback is the name of a javascript function defined on the page displaying the graph, the function will be called with the taskId as the parameter if no other arguments are specified..
Beginners tip, a full example using interactive links in an html context:
<body>
  <div class="mermaid">
    gantt
      dateFormat  YYYY-MM-DD

      section Clickable
      Visit mermaidjs           :active, cl1, 2014-01-07, 3d
      Print arguments         :cl2, after cl1, 3d
      Print task              :cl3, after cl2, 3d

      click cl1 href "https://mermaidjs.github.io/"
      click cl2 call printArguments("test1", "test2", test3)
      click cl3 call printTask()
  </div>

  <script>
    var printArguments = function(arg1, arg2, arg3) {
      alert('printArguments called with arguments: ' + arg1 + ', ' + arg2 + ', ' + arg3);
    }
    var printTask = function(taskId) {
      alert('taskId: ' + taskId);
    }
    var config = {
      startOnLoad:true,
      securityLevel:'loose',
    };
    mermaid.initialize(config);
  </script>
</body>